” GOLD Price Chart Analysis “
This week Gold has continue on the rise and everybody seems to be bullish about it. I would like share my technical anaylsis for the Gold Price chart from the Weekly Chart to anyone might be interested.
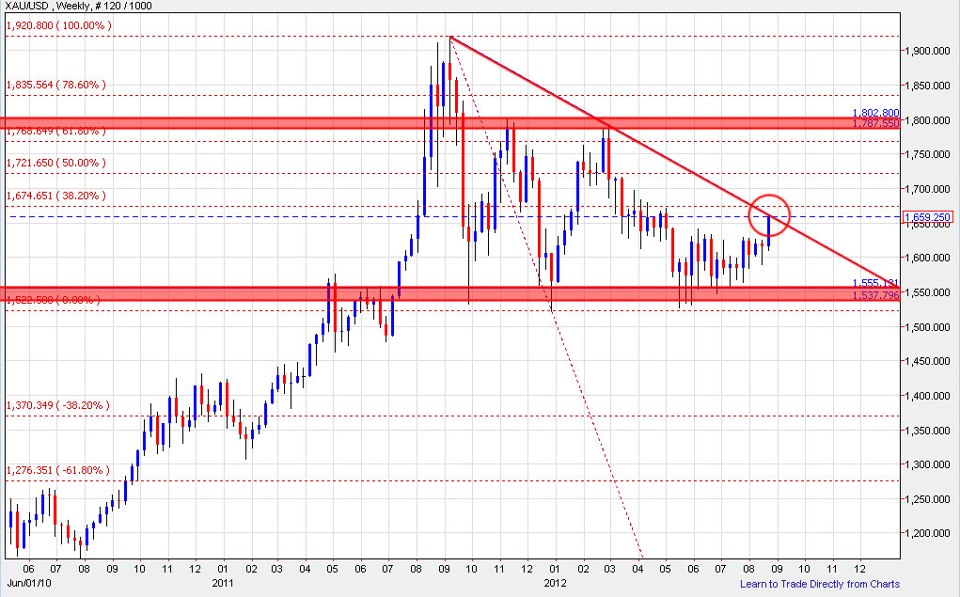
As you can see, Gold has reached the Resistance from the Falling Trend Line since September 2011 High. Looking at large, we can also see Gold has been confined in a huge Descending Triangle Pattern since. This could be potential Bearish chart pattern depending on how the price action play out.
Gold price need to break through the Falling Trend Line and the Fibonacci 38.2 around $1650 – $ $1675 which are quite close to each other to be bullish again. If breaks higher, it will look to challenge the Horizontal Resistance Level and Fibonacci 61.8 around $1760 – $1800. This level proved to be Strong Resistance Level because Price had failed to breach that level twice over the year.
If not going up, Gold will probably revisit the Horizontal Support Level around $1530 – $1560 again. This level is Strong Support level because it failed to breach three times over the year, if breaks looks lower to Fibonacci Extension at 38.2 and Fibonacci Extension 61.8 for the next strong support.
Conclusion, don’t assumption that Gold is going to go up unless the price action had proven so. Let the price action plays out before deciding on the trade set up.
Disclaimer: This is my own personal opinion only, please do you analysis clearly before deciding to start investing.


