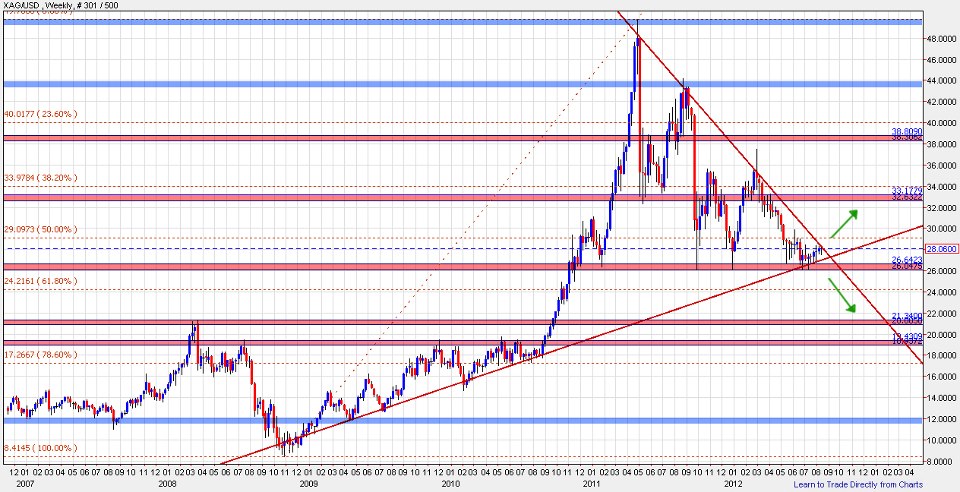
Looking at the Silver Price chart analysis, I can say that Silver Price is making a huge retracement since the 2011 High last year from $50, the infamous Commodity Flash Crash event.
Currently it is at a very critical Support level, confluence by the horizontal support level that got tested a few times in the past and also the Rising Trend Line Support since 2
I would say that if Silver manages to break the Horizontal Support Level around $26, most chances it will revisit the other horizontal support levels around $21 and $19.
Should Silver breaks the Descending Trend Line, it will mostly visit the $33 Horizontal Levels in the near future. But if this trend line breaks, this could an indication of a potential up trend until the $38.5 Horizontal Resistance level.
Bear in mind too that there are the invisible Fibonacci Levels around these few levels, including the famous Golden Ratio at Fibonacci 61.8 around $24. Also included are the Fibonacci 50.0 around $29 and Fibonacci 38.3 around $34.
Be alert to these Support and Resistance levels, and only make wise investment once the price action is clear enough.
Disclaimer: This is just my opinion, please do your analysis clearly before deciding to jump into this risky investment.


